Here is a comparison of the two, similar to an earlier blog post comparing Montreal and Philadelphia.


However, for various reasons, probably largely tied to land constraints and congestion, but likely also increases in household sizes, Los Angeles' urban area got a bit denser, the only major American urban area to do so (San Jose did too, but was quite small in 1950).

Meanwhile, San Francisco's urban area decreased in density, albeit not as much as most American urban areas. The 2010 urban area as defined by the census bureau is rather limitted in extent, excluding Santa Clara County (since San Jose is considered a separate MSA) and excluding the I-680 corridor since it is not contiguous with the rest of the East Bay (due to mountains), nor does it include anything north of San Pablo Bay.

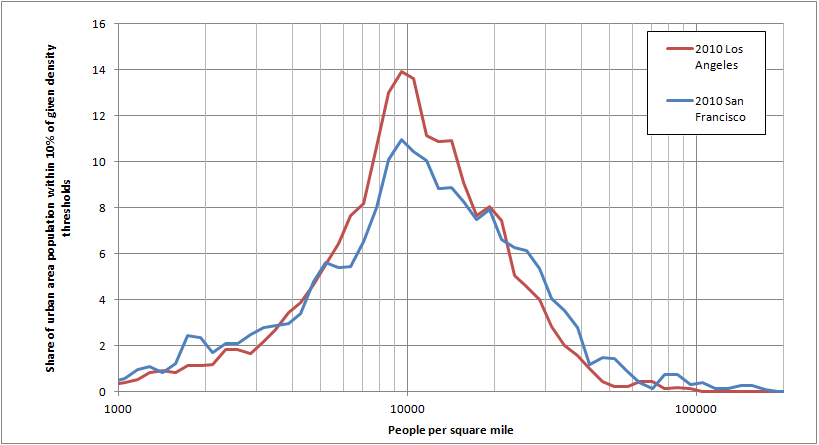
San Francisco did increase the amount of higher density, though mostly at 10,000-30,000 ppsm and not for 30,000+ ppsm, but the increase in the amount of people living at lower densities was greater.
The result is that the current density distribution of both areas is very similar, although Los Angeles' urban area is of course much more populous.
Stats
Los Angeles 1950
Population: 3,827,734
Area: 781 sq mi
Standard Density: 4,903 ppsm
Weighted Density: 9,202 ppsm
Population over 20,000 ppsm: 232,297
Population over 10,000 ppsm: 1,433,382
San Francisco 1950
Population: 1,509,471
Urban Area: 135 sq mi
Standard Density: 11,156 ppsm
Weighted Density: 21,466 ppsm
Population over 20,000 ppsm: 518,626
Population over 10,000 ppsm: 1,156,478
Los Angeles 2010
Population: 12,150,996
Urban Area: 1,736 sq mi
Standard Density: 6,999 ppsm
Weighted Density: 12,543 ppsm
Population over 20,000 ppsm: 1,957,346
Population over 10,000 ppsm: 6,263,357
San Francisco 2010
Population: 3,281,212
Urban Area: 524 sq mi
Standard Density: 6,266 ppsm
Weighted Density: 14,740 ppsm
Population over 20,000 ppsm: 746,826
Population over 10,000 ppsm: 1,742,547
No comments:
Post a Comment